Variogram view
When you create a variogram with the Statistical Analysis tool
The Variogram view
Variogram modeling requires first to calculate an experimental variogram (data points) and then finding the parameters describing the variogram model (curve). Note that only data points located within the currently selected zone, k-layer, region, facies or lithology (step 3 of the Statistical Analysis form) are used to build the experimental variogram (s). The intended workflow on the form is as follows:
- Setting the parameters for the calculation of the experimental variogram (see areas of the Variogram form image below): Direction Type, Azimuth and Lag distances for the different directions. In case you are modeling indicator variograms, you need to do this for each indicator.
- Calculating the experimental variograms by clicking 'Calculate'. This will calculate the experimental variogram (or variograms if multiple indicators) and triggers a curve-fitting to determine an initial variogram model. Changing the azimuth requires to click 'Calculate' again. When clicking 'Calculate', all previous variogram model parameters will be overwritten with the newly determined values from the curve-fitting. This affects all variogram models in case of multiple indicators.
- Customizing variogram model parameters. At this stage you adjust the variogram model parameters only (excluding Direction Type and Type). In case you are modeling indicator variograms you need to do this for each indicator.
On the Variogram View, you can specify whether you want to create a variogram for all data in your zone combined, or several variograms in specified directions, which you would typically do when you have anisotropy in your data. You do this with the Direction type drop-down box at the right side of the form. After you have chosen the number of directions in which you want to analyze your variogram, an experimental variogram is calculated for each direction, which is shown as red points in the variogram chart(s). At the same time, a curve is auto-fitted through the experimental variogram. Note that by default, the Azimuth is set to 0° for the major direction. If you have chosen to analyze variograms in three directions (i.e. when Direction type is 'Directional'), an auto-fitted model
The Variogram view has a number of areas and controls (see main image):
- The Chart Area is where one or more variograms are displayed, dependent on the number of directions you have chosen for analyzing your variogram(s). Orange points in the chart(s) indicate the experimental variogram, i.e. the semi-variance of each lag. The gray curve is the so called variogram model, which is auto-fitted through the experimental variogram values. In the background, a bar chart is displayed as blue bars, indicating the number of data pairs found in each lag size.
- With the Variogram Model Parameters, you can choose the variogram model type to be auto-fitted to your experimental variogram; Spherical, Exponential, or Gaussian. You can also create an alternative variogram model that is independent of the experimental variogram data. You do this by defining the sill, nugget and range, in which case a second curve is shown (in yellow), which is your manually created, alternative model variogram. You save the model variogram (i.e. the auto-fitted gray curve, or, optionally, the manually created yellow curve) to the Statistics Manager by clicking Save to manager at the base of the form. Saved information can only be used in the Property Calculator.
- Direction type controls the directions in which variograms are calculated and shown in the Chart Area. In the image below, Direction type 'Directional' is selected, resulting in three directional variograms (Major, Minor and Vertical directions).
- With the Experimental Variogram Calculation Parameters you control the calculation settings for the experimental variogram, i.e. the orange points in the variogram chart. If you make a change to any of the calculation parameters, such as the lag size, lag distance or direction (Azimuth), you have to click Calculate to update the experimental variogram. The model variogram (gray curve) will be auto-fitted accordingly. Click Save to manager at the base of the form to save the model variogram.
- If Direction type is 'Directional', a Variogram map is shown in the Chart Area, allowing you to graphically change the Major and Minor directions (by clicking and dragging the orange dots). You can also manually adapt the Azimuth(GN) and Dip by typing in the boxes at the right side of the form.
- The Chart Context Menu, accessed by right-clicking in a chart, offer various chart customization options.
- The Chart Options dialog can be opened from the context menu and provides various chart customization controls. It is available on every chart, see Chart options.
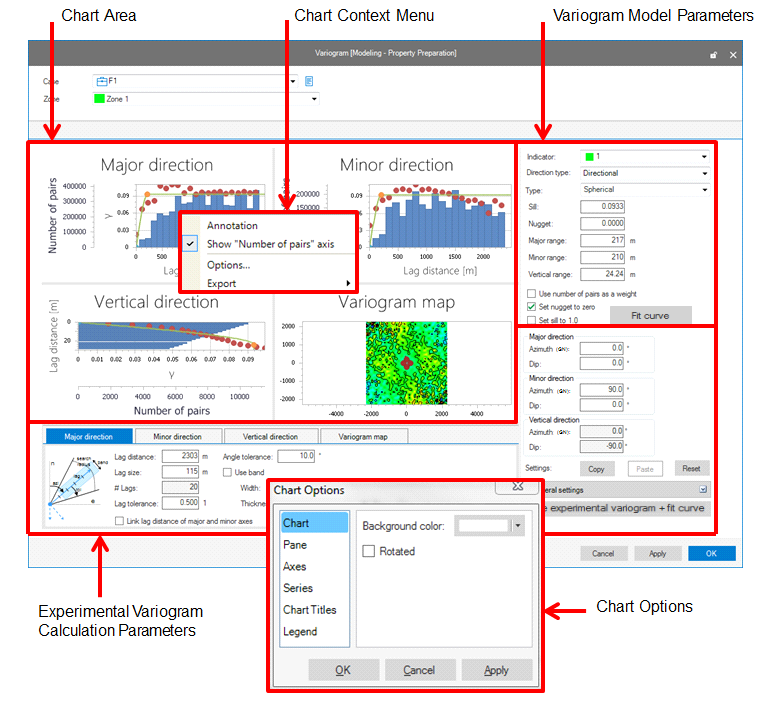
Main image: the Variogram view click to enlarge
Variogram Model Parameters (see main image)
After opening the Variogram view, by default, experimental variograms (i.e. the semi-variances) are displayed (orange dots in the chart), , for which the calculations are controlled by the settings in the Experimental Variogram Calculation Parameters area (see image). The gray curve is the variogram model, i.e. the mathematical function auto-fitted to the experimental variogram. In the background, a bar chart is displayed in blue, indicating the number of data pairs found for each lag.and a curve is auto-fitted through these data (gray curve). You can save the variogram model by clicking Save to manager at the base of the form. You can use the saved model variogram in the Property Calculator.
You can change the auto-fitted model variogram, or manually create an alternative model variogram (an alternative yellow curve appears), by using the following controls:
- Indicator This selection box is available when the variogram analysis was done on a discrete property (for example lithology or facies). It allows you to select the discrete property class (indicator) for which you want to create the model variogram.
- Direction type
Determines the number of directions for which experimental variograms are calculated, corresponding to the number of different ranges of the variogram model (and how many are shown). When Direction type is 'Directional', a Variogram map is shown, which allows you to analyze directions of spatial continuity in the underlying data. (See Variogram map for more information.) The direction type drop-down list allows you to specify the number of directions for which experimental variograms are calculated. There are three options:
- Omni-directional This allows you to specify one model variogram, which is based on the combined data points in all directions, lateral and vertical. Only one variogram chart is shown. Use this option if you have anisotropy in your data.
- Lateral omni-directional This allows you to specify different ranges in lateral and vertical direction. Two variogram charts (lateral and vertical) are available. Use this option if the spatial continuity in your data is different in lateral and vertical direction.
- Directional This allows you to model different ranges in three directions; two lateral directions (a major and minor lateral direction) and a vertical direction. For each direction, a separate variogram chart is available. Use this option if you have a lateral anisotropy as well as a different spatial continuity in vertical direction.
- Type Choose the type of curve (Spherical, Exponential or Gaussian) that you want to auto-fit through your experimental variogram (red dots). The curve is displayed in green.
The following control boxes allow you to create your own, alternative variogram model, independent of the experimental variogram (the red dots). After changing a value in any of these boxes, press Tab on your keyboard; the alternative model variogram that you just created, will be displayed as a purple curve:
- Sill The semi-variance where the variogram curve levels off and becomes a flat curve. The value indicates the maximum semi-variance.
- Nugget The semi-variance when distance between data points is infinitesimal small. The value indicates the minimum semi-variance of the data set.
- Major range Only available when direction type is 'Directional'. The lag distance at which property values become independent (variogram curve reaches its plateau) in the major direction. The major direction is the direction with the largest spatial continuity.
- Minor range Only available when direction type is 'Directional'. The lag distance at which property values become independent in the minor direction. The minor direction is the direction with the least spacial continuity (by definition perpendicular to the major direction).
- Vertical range Only available when direction type is 'Directional' or 'Lateral omni-directional'. The lag distance at which property values become independent (curve reaches its plateau) in vertical direction. Note that only data points within the selected Zone (at the top of the form) are taken into account.
- Use number of pairs as a weight If this option is checked, the number of data points for each lag size is taken into account when fitting the variogram curve.
- Set nugget to zero By checking this option you can force a nugget value of zero to the variogram curve.
- Set sill to 1.0 By checking this option you can force a sill value of 1.0 to the variogram curve.
- Recalculate Clicking this button re-fits the gray curve through the experimental variogram (orange dots), taking into account the three check-boxes at the side.
Click Save to manager at the base of the form to save the model variogram.
Experimental Variogram Calculation Parameters (see main image)
With the Experimental Variogram Calculation Parameters (see image above), you define how (lag size and distance), and in which direction (azimuth and dip) each experimental variogram is calculated for each of the specified directions. You choose the number of directions via the Direction type drop-down box at the right side of the form. When the Direction type is 'Directional' (i.e. you choose to create model variograms in three different directions), a Variogram map is displayed, which you can use to analyze the Major and Minor directions of your underlying data.
Depending on your choice of the Direction type (Directional, Omni-directional or Lateral omni-directional), the following options are available:
- Major/Minor/Vertical direction
- Azimuth(GN) Specify the azimuth (angle with Northing direction) of the direction. By default, the azimuth of the major direction is 0°, and the azimuth of the Minor direction is always perpendicular to it. The major direction is defined as the direction of the largest spacial continuity.
- Dip Specify the dip angle. By default, the dip of the Vertical direction is -90°.
- Settings
- Copy You can copy the Azimuth(GN) and Dip data to another zone or indicator (i.e. discrete property class) in your model. Click Copy, select another zone or indicator at the top of your form, and Paste the data to that zone or indicator.
- Reset Reset the Azimuth(GN) and Dip values to the initial values.
- General settings
- Total calculation This option uses all the data pairs as input to the calculation of the experimental variogram.
- Partial calculation If you select this option, only a limited number of data pairs will be used for the calculation of the experimental variogram. Specify this number in Avg number of pairs per lag and click the dice below to fill Random seed. The random seed number determines the start of sampling of the data pairs. Use the same seed number if you want to exactly reproduce the results of the experimental variogram calculation.
At the lower part of the view, a separate tab is available for each variogram that is displayed in the Chart Area. The available tabs depend on the selected Direction Type at the upper right side of the form.
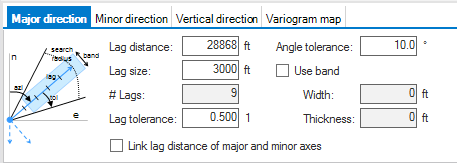
The Major direction tab in the Advanced Variogram Calculation Controls area click to enlarge
All tabs, except the Variogram map tab, have the same parameter options. Obviously, each of these options applies only to the direction specified by the tab.
- Lag distance The lag distance is the largest distance within which you want data points to be included in the calculation of the variogram. The value is equal to the product of the number of Lags and the Lag size.
- Lag size The 'step size' of the Lag distance. It is the size of a distance class into which data pairs are grouped. Each lag has one outcome (orange dot) in the experimental variogram.
- # Lags The total number of lags, which is the Lag distance divided by the Lag size.
- Lag tolerance This control specifies the tolerance used for each lag when calculating the variogram in specified direction. Lag tolerance is quoted as a part of the lag size. Hereby, the value 0.5 (50%) means that all data points between neighboring lags will be taken into account during variogram calculation; a value less than 0.5 means that some data may not be considered. This parameter cannot be greater than 0.5 to prevent double counting of points.
- Link lag distance of major and minor axes Check this option to synchronize the input controls between Major and Minor direction. With this option checked, changing a variable on the Major direction tab will update the same variable on the Minor direction tab.
- Angle tolerance This control specifies the Angle tolerance when calculating the variogram in specified direction.
- Use band Option to use a band width when calculating the variogram in specified direction. When using this option, you need to specify Width and Thickness.
Calculate If you have made changes to any of the above mentioned parameters, you have to click 'Calculate' to update the experimental variogram (red dots). The model variogram (i.e. the auto-fitted green curve) will be automatically updated as well. The calculation automatically applies to all Indicators (if present) in the selected Zone.
When happy with the results, click Save to manager.
The Variogram map tab
The Variogram map tab has different functionality than the adjacent Major, Minor and Vertical direction tabs. Its controls only affect the variogram map, not the experimental variograms nor the model variograms in the variogram charts. The main purpose of the Variogram map is to help you define the Major and Minor direction.
The variogram 'map' plot allows you to rapidly determine the presence of anisotropic spatial continuity and model your variogram(s) accordingly. The variogram map plot is a directional semi-variance chart. It does not relate to actual locations on a map or in the reservoir. The variance map is a 2D plot of lag size versus azimuth with the semi-variance shown as color-gradient. The variogram map shows you how the semi-variance changes with direction.
The variogram map plot is symmetric about its origin. Imagine the semi-variance values of an North-South variogram: as you move away from the origin of the plot the semi-variance starts to increase until the sill is reached. Now do the same for multiple directions and the variogram map plot starts to fill up. In an isotropic case you would see a circular feature in the middle of the plot with a radius equal to the range. In this case you would probably decide to go with a single, omni-directional variogram model. In an anisotropic case with the greatest spatial continuity in the North-South direction and the least in the East-West direction, you would see an ellipsoid with the long axis in the North-South direction.
In practice you will encounter more complex cases in which the variograms will have 'hole effects' which then lead to contoured features on the variogram map plot. These should not be confused with local features on a map as the variogram map is not related to coordinates.
Graphically changing the azimuth of the Major direction
If the Direction type is set to 'Directional', a variogram map is displayed. The circle on the map is a graphical representation of the Major and Minor range; the arrow is a graphical representation of the Azimuth(GN) of the Major direction. You can interactively change these settings by clicking and dragging on the tip of the arrow or on the red dots on the circle.
- By interactively changing the circle, the range of the corresponding (major or minor) variogram chart is updated, and simultaneously you will see a yellow curve (your alternative model variogram) in the corresponding variogram chart.
- By interactively moving the arrow tip, you can control the Azimuth(GN) of the Major direction, and therefore also of the Minor direction.
For more information about a variogram map, see Variogram map.
Chart Area (see main image)
Dependent on your choice of Direction type at the upper right side of the form, one or several (directional) variogram charts are shown in the Chart Area. Each variogram charts shows the experimental variogram, displayed as orange points, for which the calculations are controlled by the settings in the Experimental Variogram Calculation Parameters area (see image). The gray curve is the model variogram, which is auto-fitted through the experimental variogram values. In the background, a histogram is displayed as blue bars, indicating the number of data pairs found in each lag.
Right-click on any of the histograms to open the Context menu, where you can control axes settings and annotations, or open the Chart Options dialog. See Chart options for more information.